

A key part of digital marketing that often times business owners have difficulty to analyse is the good ol’ data. And with a mountain of information – it’s ends up being a challenge to organise and understand which insights matters the most and what actions should be taken from them. While this challenge persists, we cannot deny that if practiced correctly, the impact of the data compiled can create a wave towards not only obtaining traffic and leads but conversions too! So if you own a website and have not added Google Analytics on the back end, you’re missing out.
In case you haven’t heard about Google Analytics – this powerful platform is a free website analysis tool created by Google to allow you to track what your audience is doing in your website. How it works is Google will provide a unique code into your website and you or your web developer will need to embed it into your back end in order for Google to crawl into the website and make sense out of the data.
From getting to know your audience demographics to which pages in your website they like to visit and even how much time they spend on each page, this tool does give great insights and sets a benchmark on what is working and what isn’t working on your website. Still not convinced? Here’s 3 of our favorite features on this platform and how we’ve been using it:
- Audience Section
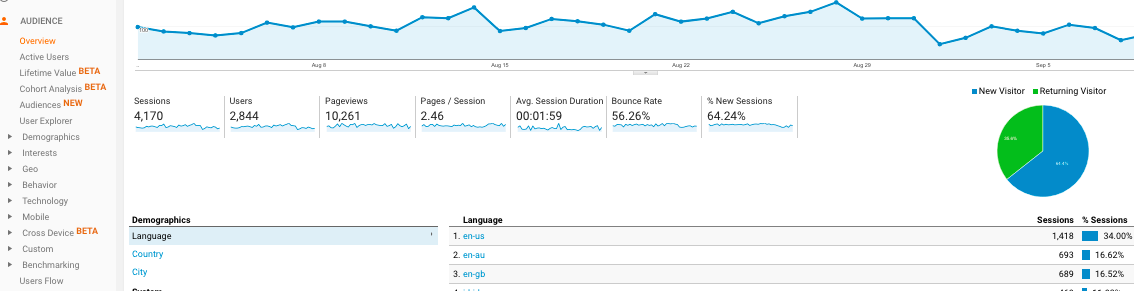
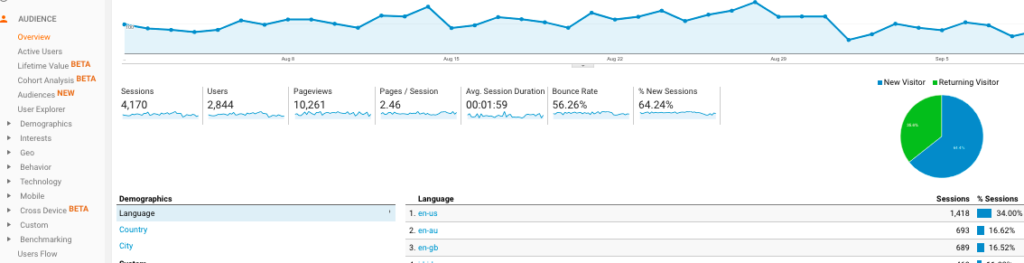 The cool thing about the audience section is you really get a chance to know where your audience is coming from, their age group, interests and even what kind of mobile devices they’re using. How this is helpful is you get to shape your content to be as relatable as possible to those who are visiting your website. By monitoring the page sessions, average session durations and bounce rate, you also get an idea of whether or not your content is driving them to stay longer on your website or not. In a nutshell, Google Analytics is a great tool to get to know your audience!
 - Acquisition Section
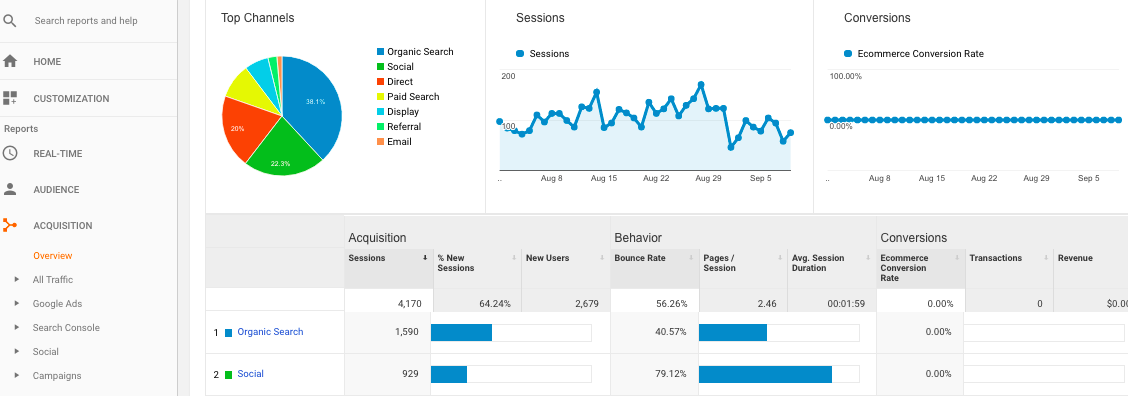
 For those who are curious to know how their audience had discovered them and which of their marketing efforts are performing best, you would be interested in the Acquisition section. The data here not only tells you which channels are bringing in the most traffic, it also tells you which periods traffic had spiked and which channels it came from. So if for example you ran an email campaign on a specific date, this acquisition section can give you an idea on whether traffic was generated from that particular effort. It’s the go-to section for marketers who want to measure their efforts!
- Behaviour Section
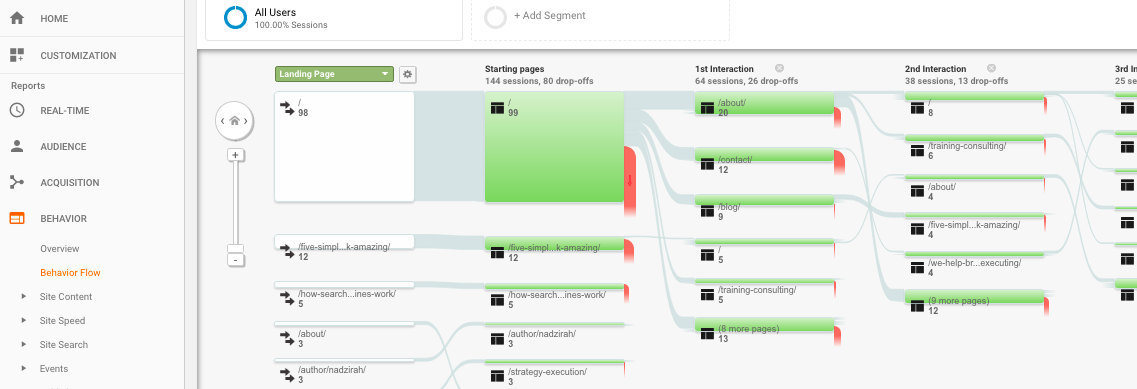
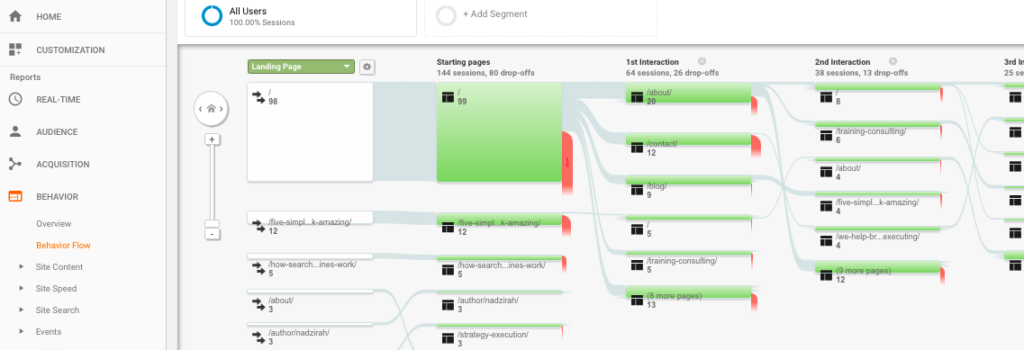 Another section (among the many!) we find beneficial is definitely the behaviour section. This feature gives you a deeper snapshot on specific pages on your website and the journey of the audience when browsing through your pages. This is especially helpful if you’re doing an A/B test on your website content and user experience as the data will let you see if your drop offs have increased or decreased based on your tests. Furthermore, if you’re an e-commerce platform it also shows you how long it takes for your customer to take an action towards purchasing a product. And if you were running a specific campaign on social media and had a special landing page for it, you could also see the outcome of their behaviour from that landing page you brought them to. So be sure to use this section often!
So now it’s your turn to share. Have you found Google Analytics beneficial to you? Leave us a comment and tell us how it has improved your overall marketing strategy!
Related Posts

From Vision To Action: Recapping Our 2024
Another year has passed yet our mission has always been the same: showcasing…

BrandStrat Summit: Connecting The Dots for Marketing & Branding Success
BrandStrat 2024 Summit was the culmination of ideas between Cult Creative,…

Interview Training Course: How to Impress Your Interviewer and Land Your Dream Job
Discover how an interview training course can be your ticket to acing job…